From Project Tiger to the People’s Tiger
A Commentary on the Decade Past and Decades to Come for Tiger Conservation in India
This longform article puts numbers of tigers and allocated budgets of the decade past to protect tigers into perspective with simple math. It proposes a shift in attitude from looking merely at numbers to pockets where numbers can increase and at making this undertaking more participatory in the coming decade. This article focuses solely on Project Tiger’s All India Tiger Estimation and Tiger Reserve allocated budgets, and not the socio-ecological ramifications of this 48 year old project, but discusses the latter as being of paramount importance than merely doubling tigers in the coming decade. This is a part of a larger piece tracing history of wildlife conservation in the context of central India. The opinions in this article are mine; data sourced are cited.
Counting tigers
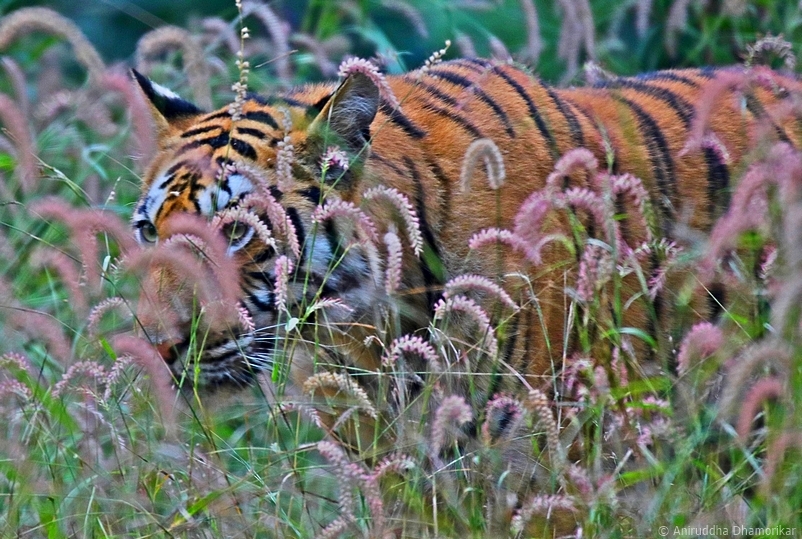
In 2018, about 12% of India’s geographic area was scoured for tiger signs – from the periodically inundating mangrove forests to over 3,000 m up the snow-covered Himalaya. This was a unique exercise in that it was also among the largest collaborations of several administrations – the central government ministry, the state government departments, autonomous and government-supported institutions, various NGOs and individuals coming together to study tigers. The people on the ground – the forest guards and field biologists – placed camera traps in over 4% of India’s geographic area to photo-capture wild tigers. It recorded over 75,000 images of tigers from a repository of over 3.4 crore images.
 |
| Monitoring tigers in every possible area they exist. |
The All India Tiger Estimation exercise, undertaken once every four years, lasts only a year, but is an assessment of the efforts of over 50 years; every waking hour of which has been spent by generations of foresters patrolling the forests, countering wildlife trade, managing human-wildlife encounters, and making the citizens of India realise the importance of tiger conservation, even as the methods of tiger population estimations are refined and redefined year after year.
With an estimation of 2,964
tigers in India as of 2018 [1] – a 74% increase from the 2010 estimates – it is
time we reflected upon the decade and had a reckoning of what lies ahead. To
present a quick backdrop that converged into this iconic decade of tiger
conservation, the wake-up call, so-to-speak, came in 2006, when India’s tigers
were estimated at just 1,411. It took years of deliberations on an
international stage to bring together the 13 tiger range countries to unite for
a single cause.
In 2010, leaders and
experts of these countries committed to a 12-year ambition of doubling the
numbers of wild tigers by 2022 by adopting the National Tiger Recovery
Priorities and the Global Tiger Recovery Program at the St. Petersburg
Declaration on Tiger Conservation. Under the Hua Hin Declaration on Tiger
Conservation at the First Asia Ministerial Conference on Tiger Conservation, 18
global tiger recovery sites were identified, eight in India. A review in 2018
found that these sites could result in a 15% increase in the global tiger
population, with a conclusion that “while sustained conservation efforts can
yield significant recoveries, it is critical that we commit our resources to
achieving the biologically realistic targets.” [2].
As the global leader
in tiger conservation, India has come a long way since the St. Petersburg
Declaration on Tiger Conservation. The same year that Nepal declared doubling
of tiger numbers from 120 in 2010 to 235 in 2018 [3], India also proved,
considering all the caveats, that it does support a population much larger than
its former estimates. This occasion calls for a look back at the decade as we
head into the next.
The Economics of Tiger Conservation
Just as there are
strings of equations behind the estimation of tiger numbers, there are strings
of numbers in the form of budgets, transactions, and donations, behind this
increase. This ‘hidden data’, so to speak, is the submerged portion of the
iceberg, the tip being the tiger numbers.
In retrospect, we must start with the basics of efforts put into tiger conservation in monetary terms. The aegis of Project Tiger has been in the forefront of the financial support provided to the 18 tiger-bearing states of India. Along with Project Elephant and the Development of Wildlife Habitats, the three form the bulk of government-supported conservation efforts under the Centrally Sponsored Scheme of Integrated Development of Wildlife Habitats (CSS-IDWH) launched in the 11th plan period (2007-2012). Between 2010 and 2020, a total of ₹ 2,226 crore or nearly ₹ 22 billion was allocated for tiger conservation under Project Tiger, a majority to the three states holding about 46% of India’s wild tigers (per recent estimates), Madhya Pradesh (₹ 583 crore), Maharashtra (₹ 475 crore) and Karnataka (₹ 191 crore) [4, 5].
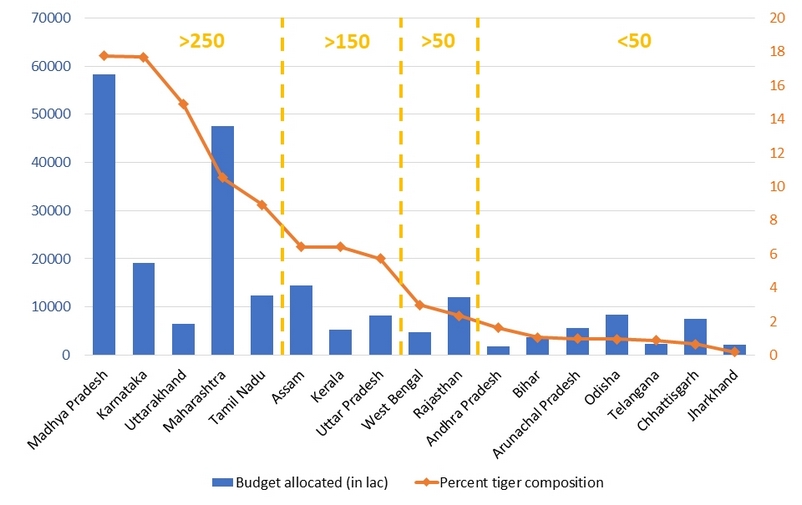 |
| Budgets allocated to tiger states between 2010 and 2020 (blue; in lacs) in comparison to percent tiger composition (orange) of the respective states (dotted vertical compartments divide tiger states according to the range of tiger estimates). |
These allocated budgets are spent on specific geographies in or around Tiger Reserves. Major per-year conservation expenditures include voluntary village relocation for which as much as 80-90% of the total fund per year is allocated whenever requested by the Tiger Reserve, the special tiger protection and anti-poaching force which are tasked with on-ground patrolling and monitoring, habitat management to maintain wild ungulate populations, technological interventions for protection, and also towards research, awareness and outreach, monitoring tools such as M-STrIPES, and eco-development through the village or council-level committees. A component also goes towards ex gratia compensation to injury or loss of life caused by a wild animal and loss of livestock and crops [6]. The recurring budget of forest services (forest guards and forest officers) is covered by the state governments and are not considered here because these are standard expenditures for salaries, insurance, and welfare of the staff irrespective of the presence of tigers.
 |
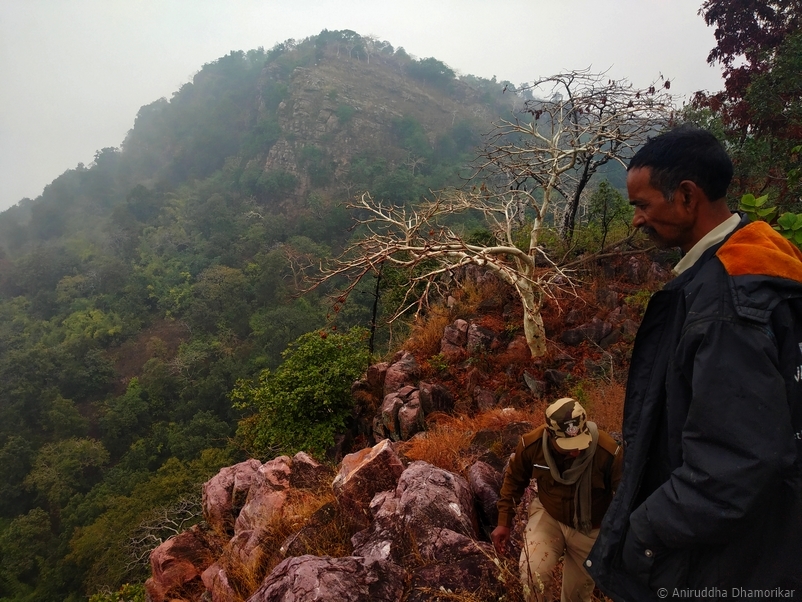
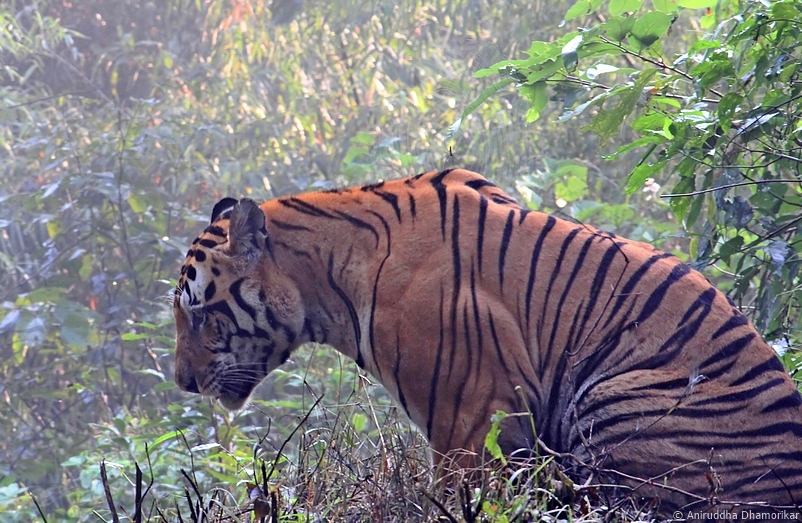
| Tiger signs are a way of knowing tiger presence, but their abundances, densities, and numbers need to be estimated with better methods, the most economical being using auto-triggered camera traps. |
Down to the basic unit
of expenditure under Project Tiger, it goes primarily towards two, the land and
individual tigers. As we reflect upon the decade in tiger conservation, it also
becomes important to look at the investment – we will get to why I call it an
investment in the last section – in a unit geographic area as well as on an
individual tiger with some simple math. Note that I use ‘allocated budgets’ and
‘investments’ interchangeably deliberately to signify that this allocation set
aside for tiger conservation is an investment, whether spent or not.
Protection costs
per square kilometre
Between 2011 and 2020, the total budget allocation per square kilometre area of a Tiger Reserve increased by 18%, with an increase of 340% for Uttar Pradesh, followed by Uttarakhand (265%) and Arunachal Pradesh (225%). For the total area of about 71,068 sq. km of Tiger Reserves [7], the investment increased marginally from ₹ 25,148 per sq km in 2011 to ₹ 29,723 per sq km in 2020. The state of Madhya Pradesh with 526 tigers saw a decrease of 25% in the centrally-sponsored budget whereas Karnataka with 524 tigers saw a 20% increase. These changes are marginal and independent since they depend upon a Tiger Reserve’s Annual Plan of Operation requesting the central ministry to approve the budgetary requirements. They make little sense if compared between tiger reserves, but they provide a perspective if looked at from state-to-state based on the number of tigers and area under Tiger Reserves.
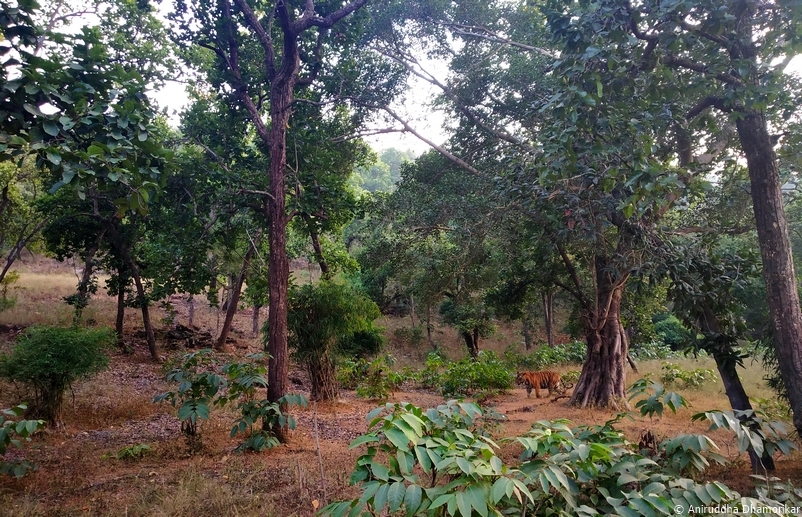
 |
| Vast swathes of forest pockets are strongholds of tigers, such as this Bandhavgarh Tiger Reserve, which recorded over 104 tigers in addition to 20 that share the habitats outside this reserve in what biologists call a wildlife corridor. |
For the states of Uttar Pradesh, this per sq km increase has been from ₹ 13,525 to ₹ 59,548; for Uttarakhand from ₹ 14,383 to ₹ 52,570; and for Arunachal Pradesh it increased from ₹ 5,619 to ₹ 18,270. These three states have seen an increase of 44%, 95%, and 0% (i.e., same population as 2010) in tiger numbers, respectively.
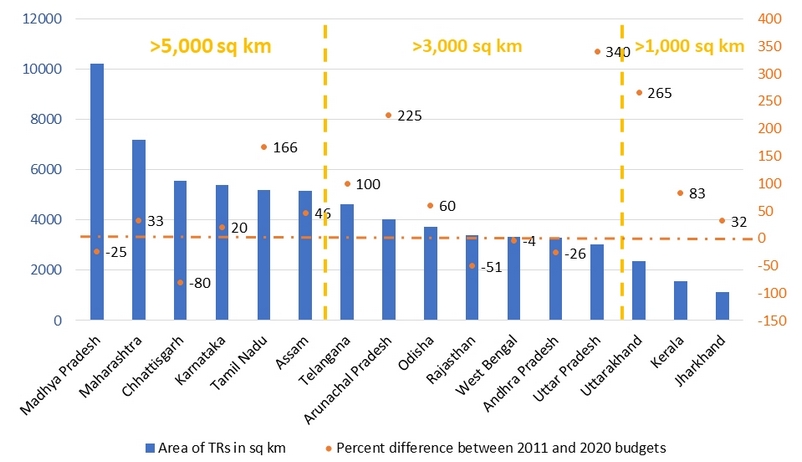 |
| The total area under Tiger Reserves (per state) against percent differences between 2011 and 2020 budget allocations under Project Tiger. |
Assuming that the
budget allocated under the Project Tiger was mostly spent in tiger reserves, on
an average, India allocated ₹ 31,316 per year per sq km in the Tiger Reserves –
the highest allocated to Maharashtra at ₹ 66,125, Madhya Pradesh at ₹ 57,098, and
Bihar at ₹ 40,486. One must note that this allocation represents conservation
of 43% of Protected Areas (the critical area) of India and about 2% of India’s
geographic area. In terms of total forest cover, it represents investments in
protection of 10% of forest area (i.e., area under forest cover) of India’s
7,08,273 sq. km forests.
Protection costs per
individual tiger
In terms of budget allocated
per tiger according to the estimated populations between 2010 and 2018, Jharkhand
has shown a 462% jump in investment as tiger numbers are estimated at five,
followed by Tamil Nadu that has seen an allocation increase of 181% as tiger
numbers increased by 62%, and Uttar Pradesh with an increase of 141% as tigers
increased by 44%.
For the two states with estimated populations over 300 tigers, the increase in per tiger investment has decreased by 34% for Madhya Pradesh, 22% for Karnataka, 115% for Maharashtra, and 2% for Uttarakhand, even as the tiger population increased by 105%, 75%, 85%, and 95% respectively, between 2010 and 2018.
 |
| Panna Tiger Reserve that had lost all of its tigers now has an estimated 25 tigers with at least two sharing the habitat outside the reserve in the adjoining territorial forest divisions. |
On an average, India allocated
₹ 4,65,021 per tiger per year considering the 2018 estimates. While it makes
little sense to associate investments in terms of individual tigers for a
number of reasons – including the fact that (i) these are estimates and not the
real count, (ii) tiger numbers are dynamic based on recruitment, migrations,
and poaching, (iii) often the association is for the work to be done in a
particular area eg. village relocation, irrespective of the number of tigers in
the area, and finally (iii) while per sq km costs depend on the level of
protection and other management practices afforded to the parcel of land, per
tiger costs are highly variable depending not only where the tiger lives
(protected area v. non-protected, even protected area v. protected area) and
their age and stage in life (mother with cubs/adolescents or wandering young
adults or prime and aged tigers) but also how ‘famous’ a tiger is (eg. Munna
from Kanha, Ustad from Ranthanbore, etc.) or how much it is in conflict with
humans (eg. T1 from Pandharkawda, the Ghunghuti Male, etc.); I think that this
association is worth reflecting upon with a realisation that this investment
per individual represents an individual tiger occupying an area but also an
individual tiger expanding into new areas or contraction of territory in some
instances. The 2018 estimation saw a 28% increase in tiger colonization, with
states such as Madhya Pradesh and Andhra Pradesh showing a substantial
increase. Furthermore, individual tigers represent the habitat (the critical
area) they form their territory in and the ecosystem (the larger space) which
they colonize. This requires investment towards tigers that live outside of
protected areas, costs which are not accounted for in per unit area which are
limited by the tiger reserve limits.
States with tiger estimates under 50 show much higher per tiger investments, averaged at ₹ 24,43,095, whereas those with over 250 tigers show much lower per tiger investments, averaged at ₹ 7,23,236, indicating that in a limited space, higher tiger numbers naturally spread per individual costs among several tigers. While only three states with lower tiger numbers show decreasing budgetary allocation, including Mizoram, Chhattisgarh, and Andhra Pradesh (in the latter’s case, the state’s two Tiger Reserves became a part of Telangana in 2014), states such as Jharkhand (32% increase), Odisha (60% increase), Arunachal Pradesh (225% increase) and Bihar (255%) contribute to this large investment.
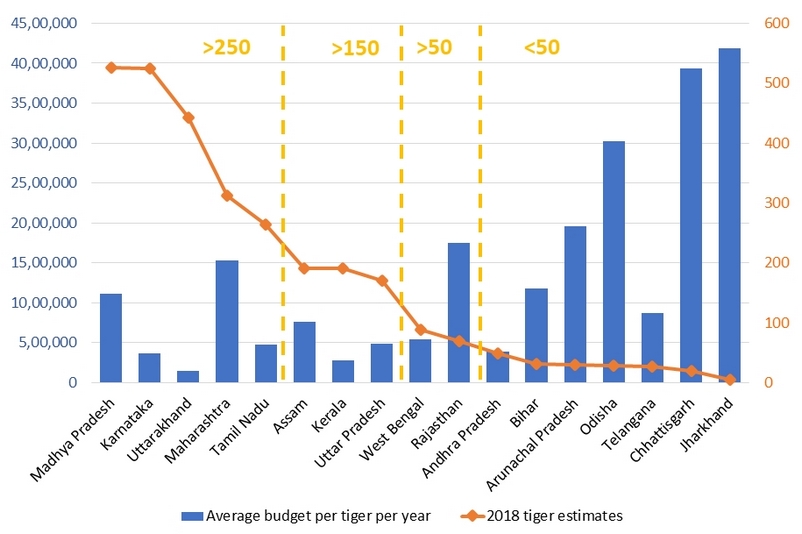 |
| Average budget allocated per tiger per year (blue) for each state against the 2018 tiger estimates (orange). |
As stated earlier,
budgetary allocations go towards a number of heads, fluctuating based on the
requirements, a large chunk of this towards planning for voluntary village relocations.
These ‘differences’ therefore, should not mean a net loss on per tiger
investments. The case in point here is the state of Jharkhand which has seen a
decline in tiger population from 10 in 2010 to 5 in 2018, with its sole tiger
reserve, Palamu indicating no tigers in 2018. Jharkhand has been on the lower
range of budget allocation, receiving, on an average, ₹ 1.68 crore in the first
half of the decade, and ₹ 2.49 crore in the later half. The allocation was
significantly increased in 2016 in preparation for the voluntary relocation of
at least eight villages from the critical tiger habitat in 2017 which did not
get through [8]. In 2018, only two villages were to be relocated although this
plan was also shelved [9]. Between 2017 and 2019, the average budget allocated
was ₹ 3.43 crore, which was brought down to ₹ 1.72 crore in 2019-20. In
essence, the allocated budget depends upon the expenditure, with the average
for the state of Jharkhand showing an increase of 32% between 2010 and 2020.
Similarly, Kanha Tiger Reserve which is on a higher side of tiger numbers has a
budget allocation averaging ₹ 20 crore between 2012 and 2019, of which 56% was
allocated for village relocation in the years 2012-13 and 2013-14 [5].
Ex gratia
compensation for human injury or fatality and livestock depredation
There is another set
of funds allocated at two different levels linked with wildlife conservation –
one at the central and the one at the state – of ex gratia compensation. A
large portion of the state-provided compensation is budgeted under non-plan
budget. These vary from state to state, for example, the ex gratia compensation
to the family of a person who died due to a direct encounter is ₹ 15 lac in
Maharashtra, in Karnataka it is ₹ 7.5 lac, and in Madhya Pradesh it is ₹ 4 lac.
A total of 28 of the 29 states compensate for loss of human life, 26 states for
livestock depredation, and 22 for crop damage, and 18 for property damage due
to wild animals [10]. For the state of Madhya Pradesh with an estimated 526
tigers, the ex gratia compensation for injury or loss of life by a wild animal
amounts to about ₹ 596 crore for 2011-2019, comprising 2% of the total budget
allotted from Project Tiger to the state for the same time period.
Ex gratia compensation for livestock depredation serves two crucial purposes, to assuage anger due to the loss incurred which may lead to retaliatory killings and to monitor wild carnivore presence in the landscape. There are two schools of thoughts on the issue of ex gratia compensation, one argues that monetary compensation is not the solution to human-wildlife negative interactions (or, human-wildlife conflict), and second, that ex gratia compensation, irrespective of the cause, is a humanitarian aid providing relief and contributing to economic security of the bereaved family. Other arguments state that ex gratia compensation is inefficient and open to fraud and corruption, therefore cannot translate into conservation actions.
Despite the
probability of misidentifying the predator, it serves as a proxy to an
otherwise manpower and fund-intensive monitoring exercise which may not be
feasible across all non-protected areas throughout the year. In Madhya Pradesh,
latest compensation amounts for cow or buffalo producing milk procures up to ₹
30,000 in compensation, bulls procure up to ₹ 25,000, cattle calf procures up
to ₹ 16,000, and goat, sheep, and pig procure up to ₹ 3,000, these amounts vary
from state to state. With about 20% estimated tigers of Madhya Pradesh are from
non-protected areas (15 forest divisions) compared to 14% in Karnataka’s
non-tiger reserves (15 forest divisions and 6 protected areas), and while wild
prey densities remain largely undetermined in such areas, it is important to
acknowledge that livestock substitute at least a part of the diet in several
non-protected areas. Based on cases registered in Madhya Pradesh, the ex gratia
compensation for livestock depredation is about 6% of the total fund allotted
for tiger conservation for the last decade.
The country-wide
perspective
To summarize, this
math is done to provide a perspective. ₹ 2,226 crore were allocated under
Project Tiger over the last decade that has seen a 74% increase in tigers. In
terms of total allocation per unit area, ₹ 31,316 per year per sq. km was
allocated on an average in the tiger reserves, and ₹ 4,65,021 per tiger per
year on an average. A large portion of this budget was allocated for village
relocation, but the information on the number of villages relocated per year or
the exact amount spent is not readily available.
Between the same span,
the budgetary allocation has increased by 81%, with an average 8% increase
across the decade. The largest boost came in 2016-17 when the allocation
increased by 121% compared to 2015-16 allocation, but generally, budgetary
allocations have seen a decreasing trend (the 2021 allocation show a further
significant reduction although it has not been considered in the table below).
Table 1. Matrix of year-wise percent differences in budget allocated across 18 states of India.
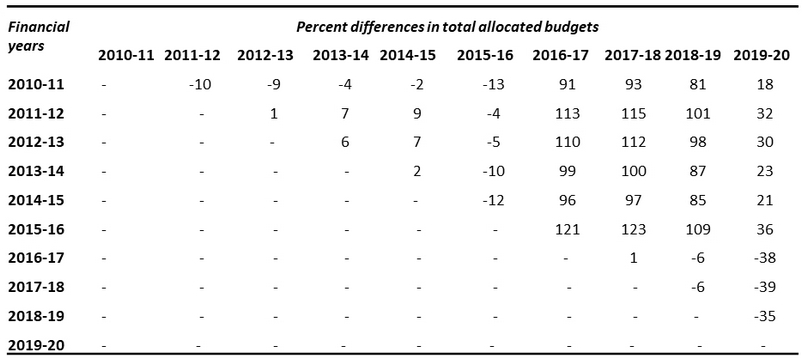 |
| Note: All India Tiger Estimation exercise years are 2010-11, 2014-15 and 2018-19. |
It is important to
acknowledge the several programmes, such the Compensatory Afforestation Fund
Management and Planning Authority (CAMPA) and the ex gratia compensation under
state budgets that aid in wildlife conservation, but these focus primarily on mitigation
circumstances, making centrally-sponsored fund for active wildlife conservation,
such as protection and habitat management, of paramount importance.
To envisage the coming
decade in tiger conservation, the past needs to be more black-and-white. For
states showing an increase in tigers by 100% between 2010 and 2018, the
increase in budget allocation averages at 123% (between 45% to 340%) with the
exception of Madhya Pradesh (decrease of 25%) and Rajasthan (decrease of 50%). To
emphasize on the above point, the state of Madhya Pradesh shows an increasing
trend in livestock depredation attributed to tigers – a 188% increase between
two decades [11]. While it remains to be known that the increase in livestock
depredation is a result of an actual increase in tiger population, it is
important for conservation managers to be equipped with knowledge that aids in
budgetary allocations and wise expenditures.
I stand of the opinion that ex gratia compensation – in addition to increased awareness – aids in conflict mitigation, but an increasing trend in conflict cases also requires additional budgetary allocation to active conflict management in the form of rapid response (eg. discouraging the animal from venturing into villages, capture and/or relocation in extreme cases) – a budgetary requirement met from the ministry-allocated budgets.
 |
| A bauxite mine and degradation of forests bang in the middle of a crucial wildlife corridor where the sink site, Achanakmar, is threatened with tiger extinction if cut off from the source site, Kanha Tiger Reserve to the west. While the mine itself might not solely lead to local extinction, it accelerates the process that usually takes decades to fall through, such as degradation & fragmentation of habitat. |
Finally, to put these
numbers in a national perspective, India’s allocated budget for tiger
conservation in the last ten years is 0.01% of India’s GDP for the year
2019-20, and 2% of India’s GDP from mining for the year 2019-20. Furthermore,
India’s GDP from forestry is about 1.7% which this estimation shows is
contributed by many tiger-bearing forests (for example, 20% in Madhya Pradesh’s
and 8% in Karnataka’s tiger estimates are from such productive forests), only a
fraction lower than India’s GDP from mining at about 2.5% in addition to 0.9%
from coal. As India aims to be more self-reliant, it requires little
imagination to realize where the efforts are being made for increasing the GDP among
the two natural resources that share the same space.
Doubling of Tigers requires Doubling of Conservation
Efforts
The baseline figures
might not give us robust estimates of per unit area or per tiger investments in
the future, but they do provide a perspective of what-was as we move ahead into
a world with more tigers. What do we consider in a world with more tigers?
Simply put, double the efforts. To elaborate, I focus on four: we must confront
the realities of human-wildlife conflict particularly in case of tigers, we
must think beyond the one-way street of fund allocation procedures, we must
rekindle the inclusionary conservation models that seem to have taken a
backseat when we speak of tigers, and mainstream the returns from conservation
investments to the peoples who share the space.
Tiger deaths and
conflicts
We’re only slowly beginning to understand whether human-wildlife interactions that lead to conflict are increasing or decreasing. The state of Madhya Pradesh shows us two paths that need further studies, one, on whether this increasing trend indeed represents actual increase in human casualties or livestock depredation incidences, or, two, that this increase is a result of years of concerted efforts in providing aid to the bereaved family or the owner through efficient access to the ex gratia compensation, increased amount of the compensation, increased transparency between the managers and the loss-bearers, or even an increase in fraud cases which may lead to a superficial increase in depredation events.
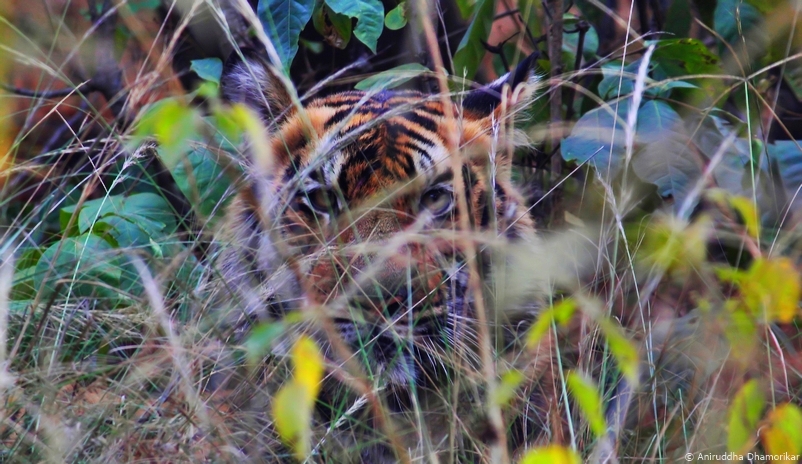
 |
| A contemplative, young adult tiger from Kanha, about to rest on a grassy slope. |
On the other side of
the same coin, over the last decade, 1,075 cases of tiger poaching have been
registered, about 39 cases on an average per year [12, 13, 14]. Tiger deaths
identified as a case of poaching have reduced gradually from over 60% in 2007
to about 35% in the last decade. On the other hand, total tiger deaths have
seen an increase from an average 80 in the first half of the decade to about 98
in the latter half.
For the state of
Madhya Pradesh, 47 cases of tiger deaths have been recorded in the last decade,
compared to 133 cases of leopard deaths [11]. There has been a 48% increase in
tiger and leopard deaths between the two decades. In terms of poaching
incidences, this increase is 60% for tigers and 54% for leopards. Among
poaching incidences, the significant increase is due live wire traps where
naked electric wires are used to kill animals (500% increase for tigers and
300% increase for leopards) and wire snares (67% increase for tigers and 108%
increase for leopards). According to the reported cases for Madhya Pradesh,
three leopard deaths are recorded for every dead tiger.
Wire snares and live wire traps are two ways of animal poaching associated with hunting for bushmeat and in protection against crop-raiding herbivores. Carnivores are largely considered a collateral, although these tools have also been used in poaching, including for sloth bears. On the other hand, ways of poaching such as carcass and waterhole poisoning and country-made bombs have seen little to no change, but comparatively, constitute about 6% of all recorded cases.
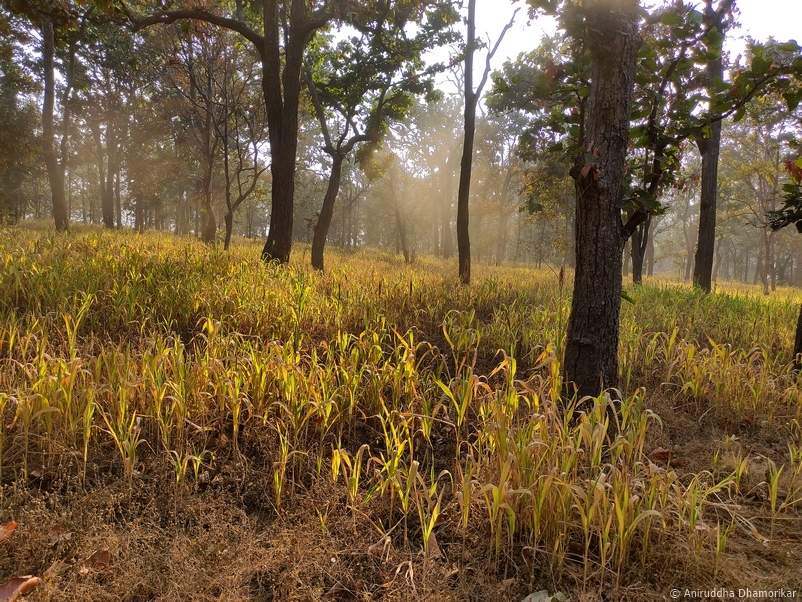 |
| Methods like growing Sorghum in forest patches to keep wild herbivores from entering farmlands is being experimented to mitigate this form of conflict. |
While the decrease in
poaching cases is as much a positive development as is the increase in
estimated tigers, it also represents the tip of the iceberg. Increase in
certain types of retaliatory measures point us towards lacunas in
human-wildlife conflict mitigation, particularly at mitigation of crop
depredation by wild herbivores. As we head into the next decade of conservation,
it is pertinent to identify and fix this gap – again through smart budgetary
allocations from the ministry – since it is evident that wire snare and live
wire traps, as indicators of an increased intolerance towards a disorderly
compensatory system, is also seeing an increase.
A more dynamic model
of resource allocation
State budget allocations for tiger densities per 100 sq. km of Tiger Reserves shows an interesting trend. Back-of-the-envelope calculations for states with densities between 4 and 12 tigers per 100 sq km show an average allocation of ₹ 37,54,932 per 100 sq km per year, and states with densities between 0.005 to 0.01 per 100 sq km show an average allocation of ₹ 14,67,627 per 100 sq km per year – a difference of 156%.
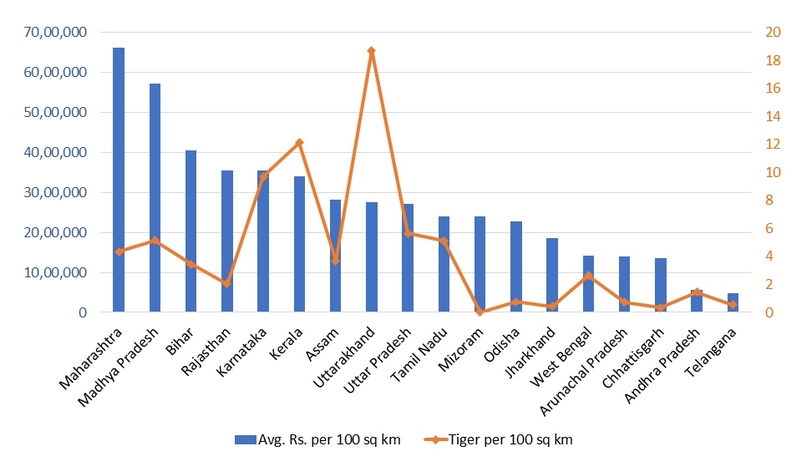 |
| Average budget allocated per 100 sq km (2010-2020) against tiger densities per 100 sq km as per [1]. |
Given that the difference in average areas of both these high- and low-density states is only about 30%, this hints at two aspects of budget allocations, that high tiger density areas requires more funds – naturally, but also that low tiger density areas attracts lower allocations. The various reasons of this allocation notwithstanding, it forms a vicious cycle of lower allocations and lower expenditures, at times reaching a tipping point where, although an area for tiger population recovery exists, is limited by various administrative constraints.
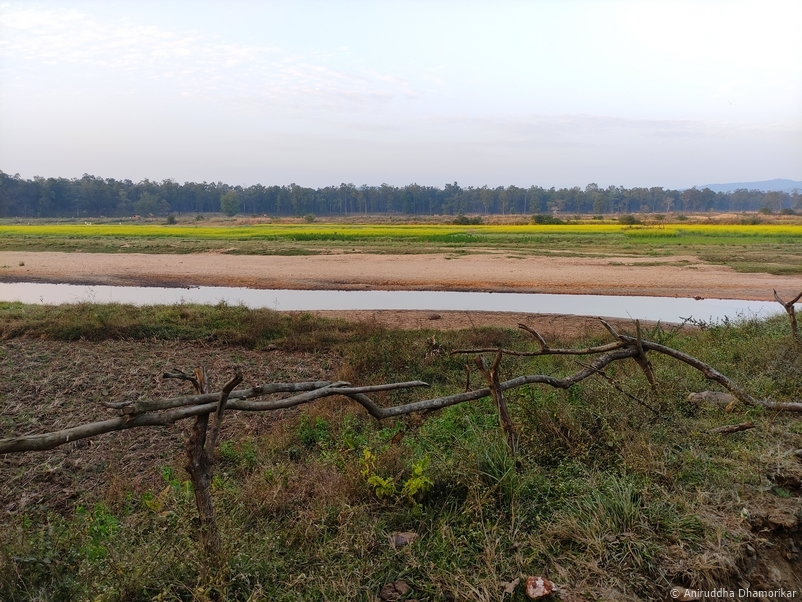 |
| A treeline of sal in the distance, fields of mustard in the foreground, Maniyari river and a wooden fence in one of the villages in Achanakmar Tiger Reserve. |
Consider the example of Chhattisgarh, which has the highest total area under Tiger Reserve of all lower tiger density states. At about 5555.63 sq km, it has consistently shown a decline in tiger numbers from 26 in 2010, 46 in 2014, and 19 in 2018 – about 58% decline below average [1]. At the same time, it has seen an 80% decline in total state budget allocation. The various reasons of this allocation are likely to be unspent fund allocation towards village relocations, habitat management, anti-poaching and tiger protection force, as well as towards population recovery projects. Unspent money does not generally come back into circulation if left unspent.
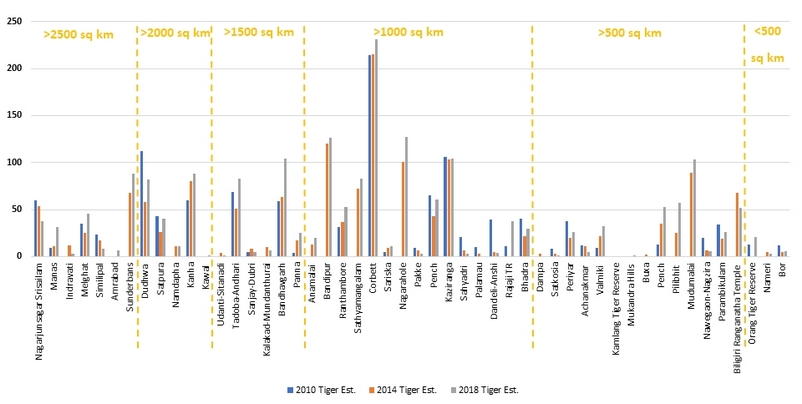 |
| The overall picture of changing tiger numbers per AITE 2010, 2014, and 2018 [1] for 50 tiger reserves classified based on total area per sq km [7]. |
States like
Chhattisgarh, most of whose tiger reserves have more ‘room’, require a two-sided
approach; one from the state to increase manpower, dynamic annual plan of
operations protocols that reconsider the previous unfinished plans, as well as
a state-level action plan with set goals and targets under the ten-year tiger
conservation plans. Two, the centre needs to seed money in such ‘sink’ states,
and create a tie-up with the nearest ‘source’ states, not only for the exchange
of tigers but also for exchange of knowledge, expertise, and handholding (if at
all it works between governments and political parties in power).
An early phase of this
source-sink partnership was seen in 2018 when India’s first inter-state tiger
reintroduction programme was carried out between Madhya Pradesh and Odisha. A
series of tiger reintroductions were planned from Madhya Pradesh to Odisha,
starting with Satkosia Tiger Reserve. Two tigers were introduced, a male and a
female. Either of the two resulted in killing of a man, outraging the local
community that relies on forest produce as a means of livelihood [15, 16]. The
male apparently died of a wound from a wire snare, while the female was kept in
an enclosure. This example highlighted some glaring holes in inter-state tiger
reintroductions, a major stakeholder of which, the local communities, were
apparently left out of the equation. A dynamic model would also account for
people participation in the decision-making process where proposed plans are
discussed before such programmes are implemented.
In addition, a more fine-scale model of such partnership has already been developed. Under the Development of Wildlife Habitats pillar of CSS-IDWH, NTCA provides financial support to forest divisions via the tiger reserves they adjoin, largely towards habitat management and protection. The expansion of this source-sink – or areas with high and low tiger densities – dynamic budget will be crucial in the coming decade.
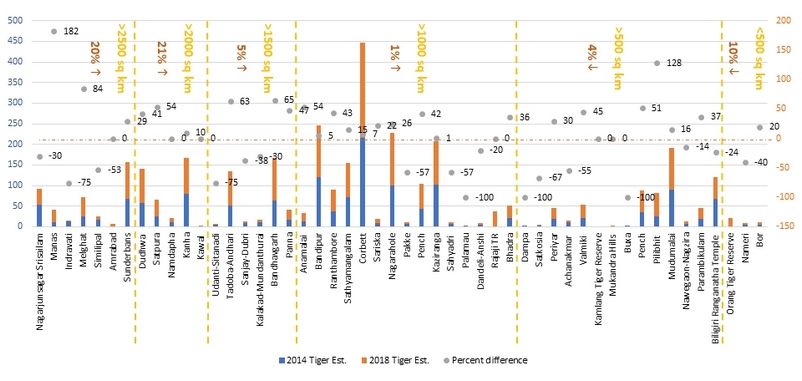 |
| Tiger Reserve-wise tiger estimates for 2014 and 2018; grey dots represent percent difference in tiger numbers between 2014 and 2018 (negative indicating a decrease); percent figures with arrows (upward for increase and downward for decrease) show average percent change in tiger numbers for tiger reserves categorized as per area in sq. km. |
The carrying
capacities of the small area and small population states should also be
estimated for protected as well as non-protected areas. States with high tiger
densities but smaller area should be considered separate from states with low
tiger densities and smaller areas. In case of the former, a significant
percentage may be dedicated in capacity building for conflict management, while
in the latter, a portion may be dedicated to habitat improvement – this
granularity is made apparent in MEETR and Security Audits, and if isn’t, needs
to be. Case in point is of Bihar, with a rough density of 3.4 tigers per 100 sq
km while the total area of the Tiger Reserve is at 899.38 sq km.
In-depth studies, of
course, will paint a better picture than superficial assumptions. For a more
cohesive approach to tiger conservation as we nearly double the tiger
population, the associated interventions need to multiply and become more
dynamic – not all Tiger Reserves are the same, just as not all tigers are the
same in personality or stripes.
Inclusionary
conservation embedded in [cooperative] management practices
Call it consequential
but obvious, we must face it, in a society where a large population relies on
nature for a number of activities, ecological and social reforms both follow
exclusionary models in India even today, and they need to be looked at not only
in an integrative approach, but also be scribed into policy and ratified into
budget allocations.
In saying so I realise
that I am stating the obvious. There are two most pertinent issues; one is
about getting lost in communication, and the second is about getting lost in
translation. The first is within government agencies – as those between
Territorial Forests and Protected Areas with the Forest Development
Corporations (FDCs). In case of corridors such as the Kanha-Pench corridor,
FDCs comprise roughly 40% of the forest area. The mandate of FDCs is quite
different than those of protected areas, hence information on wildlife movement
from a protected area to the FDC area is likely to get lost in communication.
This gap may be filled through various management-level reorganisations, such
as inclusion of wildlife monitoring in FDC-managed areas. Admittedly, this is
already being done, highlighted by cases of beat guards regularly keeping a
track of a mother tiger with cubs whenever she passes into FDC area from some
territorial forests. There are records of tigers using coupes delineated and
fenced off for felling for shelter during day time. However, the FDCs are
severely underfunded for wildlife monitoring, patrol, and protection, leaving a
glaring gap in protection.
Second is between
government agencies. At the district-level, there are many overlaps between the
works of the district administration (instrumental in land and nistar or
forest resource rights, crop-loss compensation, as well as right for resolving
grievances), the forest department (managing certain lands but also recognizing
certain user rights), and tribal welfare department (with policies and
programmes for the welfare of tribal communities). These overlaps are more
often looked upon as impediments to individual departmental works than a reason
to work cooperatively. The district administrations, the forest department, the
tribal welfare department, the various line departments including agriculture
and animal husbandry, and all the decisionmakers and stakeholders, need to share
a platform which in its present form formally exists only at the state and
national boards. If the former gap is in communication, this is in translation.
In several parts of India, several district and block-level meetings led by the
district collector jointly with other government departments, including forest
services, has demonstrated a more streamlined approach to settle grievances,
raise issues, and demonstrate ownership; this needs to be mainstreamed,
particularly in areas close to protected areas.
Several state governments have launched multisectoral programmes with an important component of sustainable natural resource use and ancillary activities which may aid in conservation. The Chhattisgarh Government’s flagship programme, Narwa-Garwa-Ghurwa-Au-Badi (NGGB) is aimed towards farmer welfare with four main pillars; natural streams preservation (narwa), cattle welfare (garwa), manure pit creation (ghurwa), and development of kitchen gardens (badi). The state forest department has been engaged primarily in natural stream preservation and providing parcel of lands for stall feeding and fodder crop growth from early on. This includes desilting and construction of check- and stop-dams which also act as waterholes for wildlife, particularly because it is also permitted in protected areas. Cattle welfare and manure collection are both tied in which encourages stall feeding and collection of manure. The government purchases manure from the farmer to process it as vermicompost which can be used as fertilizer in the garden. This producer-user cycle may decrease in free grazing specifically in areas of high human-wildlife interaction, but more importantly decrease excessive grazing pressures on natural regeneration of the forests.
 |
| Timber from tiger-bearing forests should see equitable sharing of economy with local communities. |
Integrating people’s need into tiger – and therefore forest – conservation is a link that is barely visible. The state-level concept of ‘Urja Van’ or ‘Fuelwood Forest’ has been initiated at several forest divisions where a patch of degraded forest is utilized for growth of fuelwood species for the use of the nearby settlements. Such ventures require their own assessments, but show us a way forward in sustainable and wise use of resources. A 1977 study in Madhya Pradesh predicted a shortfall of fuelwood and small timber for domestic use from 26 of the state’s 45 districts then to 39 districts by the end of the century. This was at a time when about 67% of non-commercial energy usage in six north Indian states came from fuelwood, dung, and crop residues.
Similarly, eradication
of invasive species such as Lantana camara does open up land for
grazing. Studies are ongoing to understand the process of vegetative
regeneration in such sites, but such exercises, often led by Tiger Reserves, help
open up closed habitats as ‘gauchar bhoomi’ or ‘grazing pastures’, limiting the
requirements of forest grazing by domestic livestock for at least a portion of
the year.
Reconciliation of
various programmes is important for a more concerted approach to conservation
as a whole – at watershed, landscapes, or habitat-levels, particularly when,
given the baseline, we are to see an increased population of tigers and
possibly other wild animals under the purview of tiger conservation.
From bounties to
benefits
We have come far: from
putting a bounty on a tiger’s head at ₹ 5 to ₹ 50 (in Central Provinces) in the
late 1800s to now, where we invest and receive benefits from tiger
conservation. These benefits are localized, specifically in relation to
tourism, but there are other tangible benefits that are invisible in terms of
monetary returns – the ecosystem services.
Before we venture into the invisible returns, consider the non-protected forests of Madhya Pradesh largely managed for timber and bamboo extraction. Between 2010-2011 and 2014-15, ₹ 4,631 crore was collected in revenue under sale of timber, bamboo, social and farm forestry, and other forest produce [17]. Compared to the investment in terms of budget allocation for tiger conservation for the same timeframe, the forestry returns are 95% higher. Of the 18 divisions totalling this revenue figure, 10 show low level of livestock depredation attributed to tigers, two show an increasing trend, and five total a tiger estimation of 46 tigers (8% of Madhya Pradesh’s estimated population) [1, 11], indicating that all of these divisions are tiger-bearing areas.
 |
| A tiger strolls through a Protected Area that typically considers local communities as workforce and in limited capacity stakeholders and superficially as beneficiaries of programmes that are largely negative sum games. |
For forests such as
Balaghat, reconciling attitudes by recognizing benefits from such tiger-bearing
forests is especially important, both for the managers and the residents.
Balaghat (with an estimated 21 tigers) plays a vital role in the
“Kanha-Pench-Achanakmar” block identified in the All India Tiger Estimation
(2018) report with an estimated 308 tigers. Tying-in revenues from
tiger-bearing forests with a large revenue generation may show us the way.
Balaghat has about 40% of its forests under bamboo [18] – an important resource
for commercial and industrial use, and historically has been the first producer
of bamboo in Madhya Pradesh, earning a revenue of around ₹ 30 crore on a good
year of harvest, depending largely on the forest fire intensities. The dividends
from sale of forest extractives such as bamboo and tendu leaf return to the
local communities, a vital income for forest-dependent communities of Balaghat.
An added component of ‘protection’ from wild animal encounters, acknowledgement
of the sustainability of current operations, as well as a sense of co-ownership
of these tiger-bearing forests may be the way forward for times to come.
Another aspect of
tiger conservation with local but significant benefits is tourism. Although
restricted to smaller spaces, a study of five Tiger Reserves of Madhya Pradesh
[19] has shown that resident individuals comprise about 80% of the staff
strength of lodges. In 2016-17, the revenue of ₹ 166 crore was generated by 133
lodges, in addition to ₹ 19.42 crore as gate and entry fees by the respective
Tiger Reserves. Wildlife tourism has also created four times more employment
than villages in non-tourism areas. The study shows that revenue generated from
direct employment is at ₹ 38 crores per year. Small businesses in tourism areas
generate revenue of ₹ 79 lac, the study found that this revenue is eight times
higher than non-tourism villages, with the daily turnover of small businesses
(shops, eateries, etc.) averaging more than three times than in non-tourism
areas [19].
About 45% of the lodging revenue generated is shared with local communities through various direct and indirect benefits, and about 56% through gate fee which is ploughed back into the local economy through village-level committees such as Eco-Development Committee institutionalised by the Tiger Reserves.
 |
| Ecosystem services of forests alone are recognized world over, but their role as a habitat for wildlife that is largely seen destructive save for some pockets of protected spaces remain to be recognized in the gamut of monetized ecosystem functioning. Here, a sambar deer cautiously checks out humans. |
Lastly, the
non-tangible benefits of tiger conservation come from ecosystem services. This
is where our per unit area and per tiger investments make a little sense. A
study of six tiger reserves across India shows that every rupee spent on
management leads to ecosystem services worth ₹ 200 to ₹ 500, with flow benefits
of ₹ 830 crore to ₹ 1760 crore per year [20]. Compare these figures with ₹
2,226 crore allocated for the 18 tiger states for last ten years, or the
investment of ₹ 31,316 per year per sq. km, and these numbers give us a better
perspective, that the intangible benefits under the umbrella of tiger
conservation are invisible, but, going by the statistics from this study [20], stretch
beyond our imaginations, these include gene-pool protection, carbon storage and
sequestration, soil conservation, nutrient cycling, pollination, and perhaps
far important, of water provisioning and assimilation. I must caution, however,
that these investments are lopsided, some areas see greater investment while
others are limited, this, is what we discuss next.
Tigers in the next decade
Every rupee spent on
the natural strips of land is an investment to secure our waters, soils,
forests, and the natural heritage. Let us remind ourselves that India’s culture
is rooted in nature, that the increase in tiger numbers against all odds is a
testimony that India, and especially the people who share the space with wild
carnivores, has showed us the way for coexistence, not merely in space but also
in socio-ecological cohesion, the latter is a concern that could not be detailed
in this subject’s context.
As we enter the next
decade with hope, expectations, and a few apprehensions, I remember Dr H S
Pabla trying to figure out what really ‘conservation’ means in the Indian
context [21]. He discusses an interesting play of the word ‘conservation’ as a
combination of the word ‘consumption’ of natural resources while at the same
time ensuring ‘preservation’ of those resources. This un-easy combination might
be made-up, but means a lot when we talk about mainstreaming conservation, and
that is ensuring wise-use of nature while ensuring its preservation for the
coming generations.
It is hard to perceive
a world with over 40,000 tigers as in the early 1900s. Even in those times,
hunters like Brander and Forsyth raised concerns of tigers dwindling in certain
habitats like central India. In the mid-1900s, Corbett and Champion raised
similar doubts. In the 21st century, we’re haunted by the same
question, how many tigers can we sustain? What’s different now is that this
decade marks a slow but upward trend in tiger populations after many years of
decline. Personally, while we celebrate this increase, we should also be
gearing up for the many concerns that need to be addressed, some of which are reiterations
of the section above (see Doubling tiger numbers requires doubling of conservation efforts):
Of interspecies
competition changing behaviour and population dynamics of sympatric carnivores
such as leopards, dhole, wolves, and perhaps many others such as grassland
nesting birds: Not all forests
are ‘empty’ if they don’t contain tigers, if an area was historically low in
tiger densities, beefing up tiger numbers in the name of conservation isn’t the
best practice, conservation of species that would not do well with high tiger
densities should also be considered. Having said that, one of the arguments
against this ‘naturalist’ attitude is that other animals are doing well in
larger spread of the country, eg. most canids, sloth bear, and striped hyena,
but the truth is that we don’t know how well they’re doing, larger spread
doesn’t mean larger numbers, – the general consensus among naturalists,
conservation biologists, and managers here is conflicting and would change only
when there is more granularity in the data or ‘numbers’ of other species, their
distributions, and their health.
Of human-tiger encounters: that conflict is increasing is still a
question we cannot answer without enough data. If we compare with historic
conflict incidents where a tiger resulted in deaths of many persons and cattle,
this conflict has gone down by record, however, even a single loss of life is a
case of conflict. The attention in spaces seeing the conflict as on an increase
needs allocations for conflict mitigation, rescue operations, and rapid response
units, and not on post-facto band aid solutions such as killing or
tranquilizing after the issue becomes political. For this to be possible, the
channel of communication between decision makers and ground protectors needs to
be swift – bring in the technology here, not solely in tracking ground
protectors of their whereabouts.
Of land sharing,
land rights, and participatory management: that tigers cannot exist with people – or vice versa – in this time
and space, is laid to rest by the fact that there nearly a quarter (14.3%) of
tigers outside of protected areas in the sampled 45 division [1]. For many this
is a cause of concern, for those, a question: why do we celebrate tigers and
leopards living in apparent ‘harmony’ alongside cities (eg. capital cities of
Bhopal and Mumbai) but not so much when it comes to local communities? That
tigers and humans have been sharing space for centuries is a living fact. In
many pockets of the country, they continue to thrive. Protection of forests is
a relatively new phenomenon in the history of this shared space. While I agree
that tigers would not survive without timely protection, protection of land on
which they – and humans – walk and use is a different matter. Land rights to
original inhabitants, particularly the non-protected areas such as those termed
corridors, governed by strong people-driven protection committees against the
outside forces such as of mining and other extractive or infrastructure projects,
is a healthy – I believe – way to thwart these forces than pitting a mining
ministry against the environment ministry, that is, government for government.
But that is just a naturalist’s wildest idea. How it translates into real world
needs a lot of good examples such as of the Dongria Kondhs, vis-à-vis the
examples of an elephant reserve (Lemru) whose area was slashed by a whopping
77% in the (hidden) interest of opening up coal blocks for mining. On that
note, listen: it is more and more clear now that only the government can put a
cap on the large emitters of GHGs – individuals or industries – whereas
conservation was and should be led cooperatively with the peoples if we don’t
want another Sariska or Satkosia; this is not a utopian ideas let loose, there
are exceptions such as Panna that has at least a portion of the people all for
the diamonds but not the cost of losing tigers again (In fact, Panna’s first
extirpation was not because of diamonds at all) – that new threat comes from
river-linking which is eco-hydro-socio- and economically destructive
undertaking according to some calculations.
Of economy sharing
of timber from tiger forests with and for the benefit of local peoples: it’s clear that returns from timber from
tiger-bearing forests are at par with GDP from mining. There is a need for the
overhaul of the timber industry so that peoples of these forests get fairer
returns for sustainable timber harvests and are not merely manpower. While data
is lacking on how tigers use such forests, many anecdotal records of tigers
doing well in these forests come from across the country. Just as some national
NTFPs provide bonuses to communities, including bamboo harvest, so should the
presently-monopolized timber extraction. Tying this up with forest rights is
where things become ‘complete’ but that complete picture needs a lot of
thinking beyond the scope of this piece.
Of revised compensation for voluntary resettlement: although I remain against this conservation model that limits access to means and facilities as per the Constitution, with covid-19 pandemic and with naked examples of forced evictions – either of encroached settlements or otherwise – monetary support is not only a requirement but a revision considering the change of times, aspirations, inflation, and taxation, of increasing this ex gratia compensation along with a more individual-centric and long-term engagement plan is the need of the hour.
 |
| A subadult tiger hiding (not ambushing!) from visitors. Success of tiger conservation is as much a people's success as it is of the laws and policies that govern claim to this success. |
These suggestions come
from the back of my mind having worked in tiger conservation and monitoring. In
reality, the system in place needs to be looked at thoroughly before arbitrary
– might I say – goals – or agendas – of merely doubling tiger numbers in the
coming decade.
And if there is
anything in this to celebrate, it is in the fact that tigers increased not
solely because of award-winning protected area management practices but because
of people who live with tigers – not for not killing the tigers in retaliation
but for accepting shared space since historic times, even when interactions do
go wrong –, which has received very little acknowledgment. With that note, I
hope for a new dawn of the people’s tiger, or, in other words, tiger
conservation led by the people which not only includes consent and
deliberations but also major stakes through active participation in tiger
conservation management plans, tiger relocation wherever people reside, and in
shaping tiger-centric policies.
By saying so, I may be attracting some wrath for my opinions because, among many uncertainties, it may limit tiger growth, but this growth should not be the sole agenda in the new decade, it should be of uniting people with and for the tiger – seeing the per sq. km and per tiger investments in the right place to see species growth but also the sustainable – and tangible – growth of the whole region: how the growth in tiger numbers benefits people should be the question this decade answers.
--
References in the order of first citation
1. Jhala, Y.V., Qureshi, Q. and Nayak, A.K. (eds) 2020. Status of tigers, copredators and prey in India, 2018. National Tiger Conservation Authority, Government of India, New Delhi, and Wildlife Institute of India, Dehradun. ISBN No. 81-85496-50-1
2. Harihar A, Chanchani P, Borah J, Crouthers RJ, Darman Y, Gray TNE, et al. (2018) Recovery planning towards doubling wild tiger Panthera tigris numbers: Detailing 18 recovery sites from across the range. PLoS ONE 13(11): e0207114. https://doi.org/10.1371/journal.pone.0207114
3. Jazynka, K. 2018. Nepal’s tiger population nearly doubles in last decade. National Geographic. Retrieved from: https://www.nationalgeographic.com/animals/2018/09/tiger-population-nepal-endangered-big-cats-news/
4. MoEFCC (2019) Tiger corridors in country. PIB Delhi. Note: This is a written reply to questions in Rajya Sabha.
5. MoEFCC (2016) Lok Sabha Starred Question No. *144. Human-animal conflicts. Government of India. Note: This is a written reply to questions in Rajya Sabha.
6. NTCA (n.d.) Tiger conservation in India and voluntary village relocation from critical tiger habitat of tiger reserves. National Tiger Conservation Authority.
7. WII ENVIS (2020) Tiger reserves. Retrieved from: http://wiienvis.nic.in/Database/Tiger%20Reserves%20_8222.aspx
8. The Pioneer (2019) Rs. 10.28 crore Central funds to PTR in 3 years. Retrieved from: https://www.dailypioneer.com/2019/state-editions/rs-10-28-crore-central-funds-to-ptr-in-3-years.html. Note: This is in context to village relocation in Palamu Tiger Reserve, Jharkhand.
9. Niyogi, D G (2018) To conserve tigers, 2 villages in Jharkhand to be relocated. Down to Earth. Retrieved from: https://www.downtoearth.org.in/news/wildlife-biodiversity/to-conserve-tigers-2-villages-in-jharkhand-to-be-relocated-61288
10. Karanth, K K., Gupta, S., Vanamamalai A. (2018) Compensation payments, procedures and policies towards human-wildlife conflict management: insights from India. Biological Conservation. https://doi.org/10.1016/j.biocon.2018.07.006
11. Madhya Pradesh Forest Department (n.d.) Madhya Pradesh Government, India. Retrieved from: https://mpforest.gov.in/
12. Wildlife Protection Society of India (n.d.) WPSI’s tiger poaching statistics. Retrieved from: http://www.wpsi-india.org/statistics/index.php
13. Aggrawal, M. (2019). Tiger deaths hit the 100-mark again, but number down from previous year. Mongabay. Retrieved from: https://india.mongabay.com/2019/01/tiger-deaths-hit-the-100-mark-again-but-number-down-from-previous-year/
14. Tigernet. (n.d.) Tiger reserve statistics. National Tiger Conservation Authority and TRAFFIC India. Retrieved from: https://www.tigernet.nic.in/msStats.html
15. The Hindu (2018) Tiger translocated from M.P. to Odisha dies. Retrieved from: https://www.thehindu.com/news/national/other-states/tiger-translocated-from-mp-to-odisha-dies/article25499520.ece
16. Kumar, M (2020) Setback in inter-state tiger relocation as Odisha prepares to return Sundari to MP. Mongabay. Retrieved from: https://india.mongabay.com/2020/07/setback-in-inter-state-tiger-relocation-as-odisha-prepares-to-return-sundari-to-mp/
17. Comptroller and Auditor General of India (n.d.). Forest receipts in Madhya Pradesh. Audit report (revenue sector). Retrieved from: https://cag.gov.in/sites/default/files/audit_report_files/Chapter_8_Forest_Receipts.pdf
18. Mission Director, MP State Bamboo Mission, and CEO, MP State Bamboo & Bamboo Crafts Development Board. (n.d) Madhya Pradesh State Bamboo Mission. Retrieved from: http://apps.mpforest.gov.in/MPSBM/vision_document.pdf
19. Chundawat, R. S, Merten, J. Agasti, S. Sharma, K. Raju U. and Matthews, J. 2017. Value of wildlife tourism for conservation and communities: a study around four tiger reserves in Madhya Pradesh (Part-I, Tourism infrastructure and revenue). Bagh Aap Aur VAN (BAAVAN) and TOFTigers
20. Verma, M., Negandhi, D., Khanna, C., Edgaonkar, A., David, A., Kadekodi, G., Costanza, R., Singh, R. Economic Valuation of Tiger Reserves in India: A Value+ Approach. Indian Institute of Forest Management. Bhopal, India. January 2015. Retrieved from: http://iifm.ac.in/wp-content/uploads/2016/06/IIFM-NTCA-REPORT.compressed-min.pdf
21. Pabla, H. S. (2015). Road to nowhere. Wildlife conservation in India – 1. Pothi.com
Comments
Post a Comment